
In my introduction to Visual Studio Application Insights, I covered the basics including your options to get up and running with real metrics in minutes. Today I want to touch on the limitations of the free tier and the options available to you if you start to outgrow it.
What does the free tier provide?
There are three tiers to choose from, Free, Standard and Premium, and the main difference is that you need to hand Microsoft some money as the number of data points you record increases. The inclusive figures for each tier are:
- Free: 5 million other data points
- Standard: 15 million other data points
- Premium: 50 million other data points
You may notice I say other data points. That's because all tiers include unlimited session data meaning you can get metrics about user counts, session length, environment info and device details. It's once you get past this that you are in the other data point realm.
Each tiers also includes:
- Unlimited number of hosts or devices
- Unlimited session data
- 7 days of raw data
- 90 days of aggregated data
Five million data points is a lot, right?
Yes, that's a lot of data you could be collecting, but you may find you burn through this very quickly indeed just as I did if you don't monitor things carefully.
Luckily Microsoft do watch your back and will start e-mailing you when you reach 80% usage. Once you hit 100% you can have logging stop, or upgrade to a larger plan. On the Standard plan, you can also opt to use a PAYG model that will see you billed around £1 for an extra million data points, so if you do require more than 15 million data points but can't push the boat out to pay for the Premium offering, you could save a few pounds by paying for the extra data points as you use them.
As I said, I found 5 million data points ran out very quickly, but the site this was running on wasn't a small site at all. I had installed AI on a multi-tenanted site that ran across 6 web servers. That resulted in a lot of data coming in from around 40 IIS sites, and it chewed up those data points in less than a week.
Time to upgrade to a higher plan
Total time taken: ~30 seconds.
It is this simple:
- Login to the Azure Portal
- Select your AI account
- Load up the Settings blade
- Select the Quota + pricing option
- Click on your current pricing tier
- On the new "Choose your pricing tier" blade, select your preferred pricing tier and save changes.
Job done.
But what if you want to make the most of the free plan or can't afford to upgrade to a plan with a bigger allowance?
ata sampling to the rescue!
Out of the box, Application Insights records everything you throw at it which is great and is the best way to get true insights in to your application or web app.
However you may be happy with sampling the data and only processing a fraction of it. Everything outside of the sample size you configure is thrown away. Microsoft's description of sampling goes like this:
Sampling is a feature in Application Insights that allows you to collect and store a reduced set of telemetry while maintaining a statistically correct analysis of application data. It reduces traffic and helps avoid throttling. The data is filtered in such a way that related items are allowed through, so that you can navigate between items when you're performing diagnostic investigations. When metric counts are presented to you in the portal, they are renormalized to take account of the sampling, to minimize any effect on the statistics.
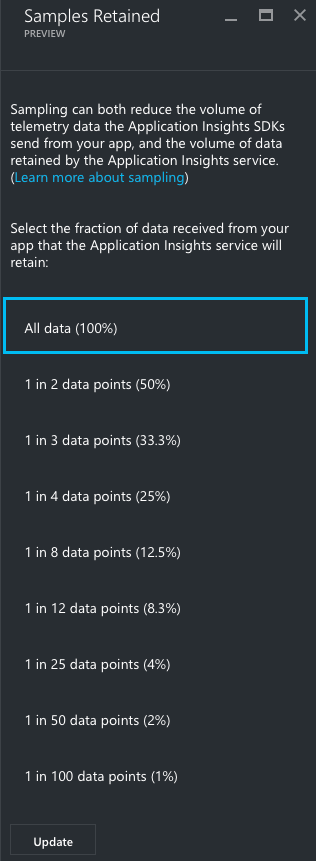
The settings here are accessed from the same Quota + pricing blade that you used to set your pricing tier above.
As shown in the image to the right, with a few click you can start sampling your data and stretch those free data points even further before you have to start coughing up any money.
This post has covered the initial pain points I went through and I hope it helps you to get up and running. When I get a little more time I will write another post about the basics of application monitoring and putting all of this data to some use.